Introduction
Objectives
In an industrial environment we quite often need to
- describe an industrial plant consisting of a bunch of different parts, each having a certain purpose and set of properties, and which are related in various ways
- manage process or maintenance data of the plant and its features
- do a high-performance cost-benefit analysis and create key performance indicators
Therefore we need to
|
15 px „Dissemble“ the system into theoretical blocks representing the real as well as intangible parts of the system.
|
Plant picture
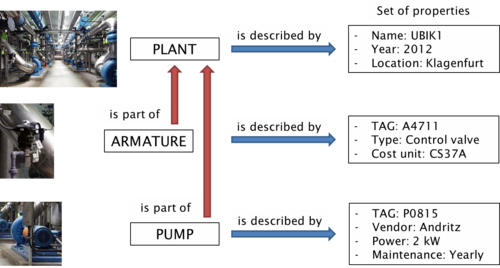
Lets start with a simple picture and have a look what blocks we find in a possible plant
A closer look at the "PUMP" block reveals its properties and property values
Of course, a plant consists of multiple pumps, each described with the same set of properties (TAG, vendor, power, maintenance data). The real pumps in the plant are distinguished by different property values as given in the table.
| Pump | TAG | Vendor | Power | Maintenance |
|---|---|---|---|---|
| #1 | P0815 | Andritz | 2 kW | Yearly |
| #2 | P0816 | Andritz | 5 kW | Monthly |
| #3 | P0817 | Sulzer | 4 kW | Yearly |
We can redefine or extend our objectives by
Transition
From a plant picture into UBIK
| Plant model | |
|---|---|
| |
Pump |
| TAG Vendor Power Maintenance | |
| P0815 Andritz 2 kW Yearly |

