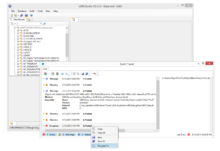
Event Tracer
The Event Tracer monitors and visualizes events occuring in the UBIK® system environment immediately, while the event data is also written by the logging mechanism in the background. This enables the user to watch events as they happen without the need to open log files. These events can be errors and warnings as well as messages generated out of the customizing code for debugging purposes.
Logging list
The list shows all events that happened since the start of the Studio session. Every entry has an information header shown in the list, consisting of the type and the time it happened as well as the time that elapsed since it happened, which is updated frequently. Every entry then can be expanded to show the full amount of infomation included in this event:
Message Types
UBIK® Event Tracer is able to show the following event types:
| Message type | Content |
|---|---|
| Error | events the user should pay high attention to because the system is in a vulnerable state (marked with red error symbol); if the error message also provides a stack trace, the stacktrace will be shown on the right of the list box |
| Warning | events that have to be investigated because they are potentially important to the productive use of the system (marked with yellow warning symbol) |
| Message | events that support the user in debugging or finding problems in general (marked with blue message symbol) |
Toolbar
The Event Tracer features a toolbar with the following items, from left to right:
| Item | Purpose |
|---|---|
| Select Category | Here the user can check or uncheck the categories to be shown in the list; changing this will hide or show the selected category of events in the list |
| Sort by time stamp | this will sort the entries by the time stamp; clicking this repeatedly will change the direction of the sorting between ascending and descending time stamp |
| Sort by category | this will sort the entries by the level of importance; clicking this repeatedly will change the direction of the sorting between important messages shown on top or at the bottom of the list |
| Expand all items | this will expand all list entries to show all the information behind |
| Collapse all items | this will collapse all list entries to show their headers only |
| Copy to Clipboard | this will copy the content of the currently selected event(s) |
| Copy all to Clipboard | this will copy the content of the all listed events to the clipboard |
| Save to file | Saves the content of the currently selected event(s) to a text file |
| Save all to file | Saves the content of the all listed events to a text file |
| Clear all items | Clears the event list |
Status bar
The Event Tracer features a status bar at the bottom showing the fololwing information:
- number of each event type; clicking these items will also hide or show the respective type of events int the list.
- last event including time stamp; clicking on this item will automatically show and select the item in the events list.
Context Menu
By right-clicking an event in the list, a context menu is shown:
| Item | Purpose |
|---|---|
| Copy to Clipboard | this will copy the content of the currently selected event(s) |
| Copy all to Clipboard | this will copy the content of the all listed events to the clipboard |
| Save to file | Saves the content of the currently selected event(s) to a text file |
| Save all to file | Saves the content of the all listed events to a text file |
| Navigate to... | Navigate to the ubik object involved in this message; this menu item is only enabled if there is information about the involved UBIK object included in the message |

