
Live Values
Live value properties incorporate the features of tracking certain values including information about the reliability of the displayed value. Such properties update themselves frequently within a configured timespan. In addition, various information about freshness, measurement quality and synchronization to the client are presented to the user.
Live value properties may be displayed either within the content browser as property (Android) or within the content child list browser (as previewed property) and the documents/details view (Windows).
Both platforms show the properties on the map view upon selecting the regarding object.
Guide for Implementing Live values
Content Browser
The row for live value properties differ only slightly from normal property rows. On the left of the property value, below the description, is a connectivity indicator icon (reminding of the connectivity icon from cell phones). The more current the property value and the better its quality is, the better connectivity is indicated. If all bars are greyed out and a small red cross is shown, the last update happened very long ago or no update was received at all, or the measurement quality is bad. For detailed information about that, the detail dialog is necessary.
Connectivity Indicator

The connectivity indicator has the following states, from left to right:
- Good
- Questionable
- Bad
Note that the connectivity indicator combines the freshness and the measurement quality of the live value, thus describing the overall reliability of the value instead of just how recent it is.
The following gallery gives an overview about the possible synchronization states of live value property rows.
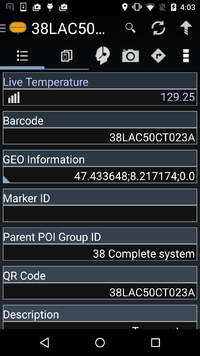
Reliable live values (Android)
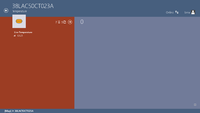
Reliable live values (Windows)
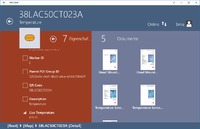
Reliable live values in the document/details view (Windows)


Map view


Upon clicking a correctly configured object within the map view, properties are shown within the opened dialog. It is important to know, that only High priority properties are shown here, altering the priority threshold setting may change the visibility of the live property in the map view.
Detail dialog
The freshness is very crucial in order to know whether the live property value can be trusted, but there are other influences like how good the measurement itself was. These information gets displayed via a dialog, the user can upon upon clicking the freshness indicator symbol both in the content Browser or the map view. Within the dialog, serveral detailed information can be seen:
| Description | Information |
|---|---|
| Live Value | Provides the same information as the row itself, namely value and as icon the connectivity indicator. |
| Recentness | Displays how long ago the last syncronization was, based on the internal freshness evaluation system. |
| Last Synchronization | Displays the exact timestamp of the last successfull synchronization, out of this, the recentness is evaluated. |
| Measurement time stamp | Measurement time stamp provided by the measurement unit itself (for instance a pressure measurement unit). Should not be trusted entirely since device time and measurement unti time could have a huge difference. |
| Measurement quality | Quality information provided by the measurement unit or data collecting instance (e.g. OPCUA Server) which together with the "Recentness" gets combined to evaluate the freshness indicator. In addition, a more detailed description about the measurement gets displayed if available. |
Some examples how such a detailed information dialog looks like in the following gallery:
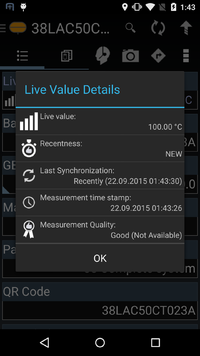
Fresh live values (Android)
Fresh live values (Windows)

